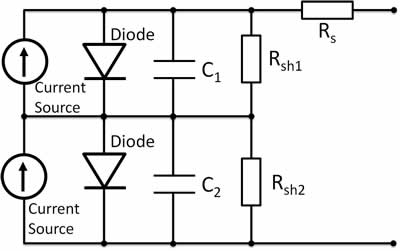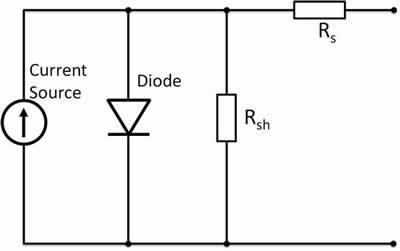
Figure 1. Equivalent Circuit of a Si Photodiode
|
The origin of hysteresis in the I-V curves of Perovskite solar cells (PSC) were clarified using equivalent circuit model and simulation of their I-V curves by our group in 2015 (please see the reference below).
The behavior of a silicon (Si) photodiode has long been understood and simulated using a well-established equivalent circuit model, illustrated in Figure 1. Building upon this foundation, our team has pioneered an equivalent circuit model specifically tailored to authentically mimic the hysteresis effects observed in PSC, thoughtfully depicted in Figure 2.
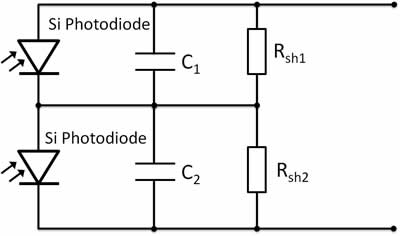
This breakthrough allowed us to develop a robust equivalent circuit model for PSC, which employs a combination of Si photodiode components, capacitors, and resistors, all expertly illustrated in Figure 3.
Our research not only clarified the enigmatic hysteresis within PSC I-V curves but also paved the way for a more comprehensive understanding of their electrical behavior, offering promising insights for further advancements in this cutting-edge technology.
References:
- L. Cojocaru, S. Uchida*, PVV Jayaweera, S. Kaneko, J. Nakazaki, T. Kubo and H. Segawa
"Origin of the Hysteresis in IV Curves for Planar Structure Perovskite Solar Cells
Rationalized with a Surface Boundary Induced Capacitance Model. "
Chemistry Letters, 44(12), 1750-1752 (2015).
*DOI: 10.1246/cl.150933 *Editor's Choice
- L. Cojocaru, S. Uchida, PVV Jayaweera, S. Kaneko, J. Nakazaki, T. Kubo and H. Segawa
"Determination of unique power conversion efficiency of solar cell showing
hysteresis in the IV curve under various light intensities."
Scientific Reports , 7, 11790 (2017).
*DOI: 10.1038/s41598-017-10953-3 *Top 100 read article (Top #13 in Materials Science) in 2017
Feel free to reach out for any inquiries related to the PSC Model: viraj@spd-lab.com |
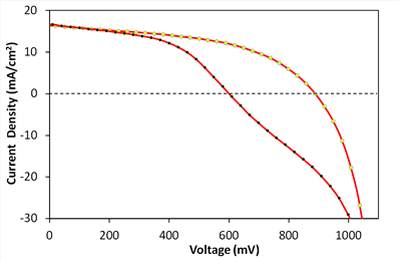
Figure 4. Measured forwarded and reverse I-V curves of PSC Model
|
Active Area : 0.0162 cm²
Illumination : 1 SUN (AM 1.5 simulated sun light)
Scan start voltage : 1100 mV
Scan end voltage : -50 mV
Scan step size: 30 mV
Holding time: 50 ms
Voc (reverse) : 888 mV
Voc (forward) : 601 mV
PSC (reverse) : 7.2 %
PSC (forward) : 4.9 % |