Four in one
-
Solar Cell I-V Curve Tracing
-
Maximum Power Point Tracking
-
Four Quadrant I-V Analysis
-
Four Probe Resistance Measurements
Experimental results taken by Segawa laboratory, University of Tokyo
Click here to download pdf version of brochure
Findout the unique features of SPD Lab PV Power Analyzers
Findout the unique features of SPD Lab PV Power Analyzers
Download VK-PA-100 Software
|
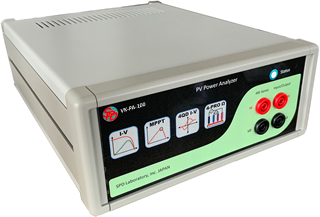
PV Power Analyzer VK-PA-100 Specifications |
Measurement Range
|
Voltage: ±10 V
Current: 1 A
with 5½-digits resolution |
Measuring Technique
|
Digital Source Meter |
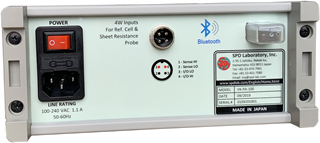
Inputs |
Front: 4 probes for PV devise
Back: 4 wire connector for reference cell (light intensity measurement) |
A/D Converters |
16 Bit (2 independent ADCs for V & I measurements)
|
User Interface and data collecting |
Computer software is provided for control of all the functions and data logging. Measurement data can be saved as a text file and directly plotted on ®Microsoft Excel graph. (Windows based PC required) |
Communication |
Bluetooth |
Power Requirement |
100 – 240 VAC (50-60 Hz) |
| Electrical standard |
  |
| Dimensions |
93 mm x 210 mm x 350 mm |
| Weight |
2.5 kg |
| |
|
Main Functions |
Solar Cell I-V curve Tracing |
 |
User selectable START, END and STEP voltages. Plots current and power vs. voltage curves. Calculated results include Voc, Isc, Jsc, Pmax, Vmpp, I mpp, FF, Rs, RSH, ƞactiveA, and ƞgeoA . User can set the desired scan speed, scan time, or holding time. Advanced I-V option allows initial, middle, and end point holding times. I vs. t transient plot for all data points and/or under a selected fixed voltage. |
Maximum Power Point Tracking (MPPT) |
 |
Analyzer acts like the best load for the cell to extract maximum power and keep tracking MPP continuously. Plots Pmax ,Vmpp , Impp and Efficiency vs. time curves and also display current/power vs. voltage plots. In addition user can directly measure the open circuit voltage, short circuit current and plot the current vs. time under a given fixed output voltage. |
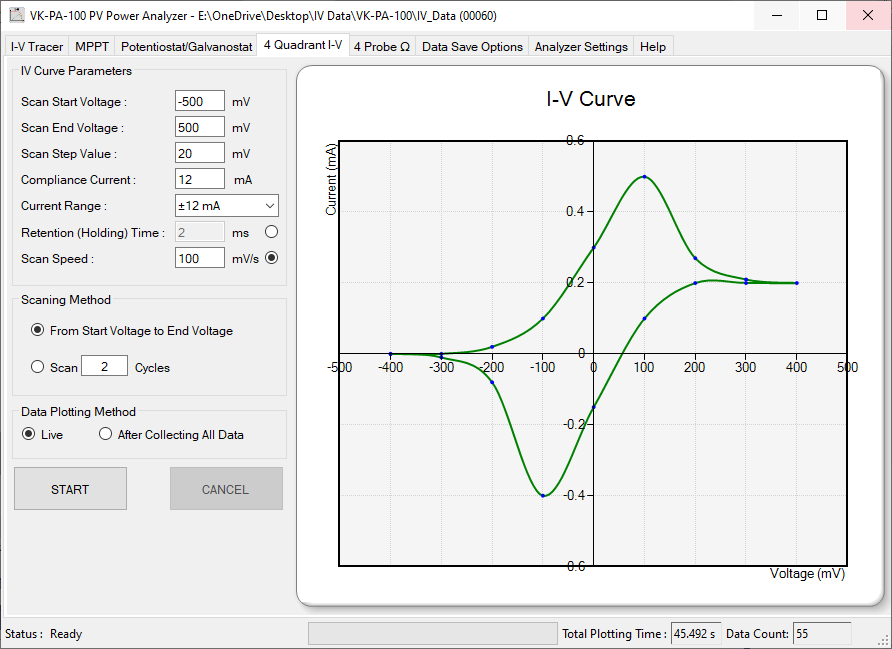
Four Quadrant I-V Analysis |
 |
User selectable START, END, STEP voltages and SCAN SPEED (mV/s). Plot current vs. voltage curve for given number of voltage sweep cycles in potentiostat mode. Can be use in 3 electrodes liquid cell with reference electrode. |
Four Probe Resistance Measurements |
 |
Three special functions included to easily measure sheet resistance, resistivity, and resistance. Geometric correction factors are automatically calculated according to size and measuring probe location on the sample which are entered as parameters. Measurement range 2.0 x 10⁻³ to 5.0 x 10⁶ Ω . |
|
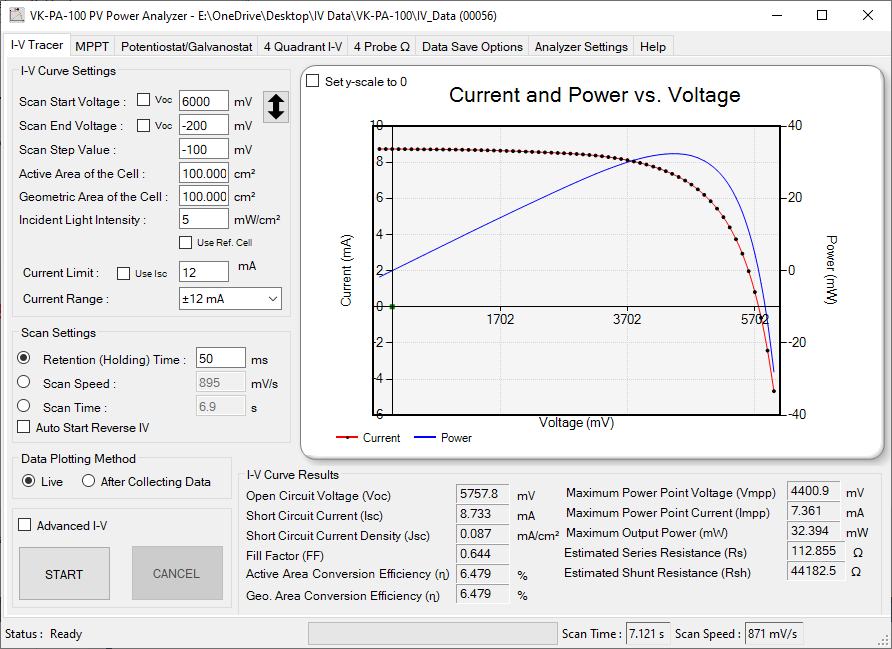
Screenshot of "I-V Tracer" tab of the control software
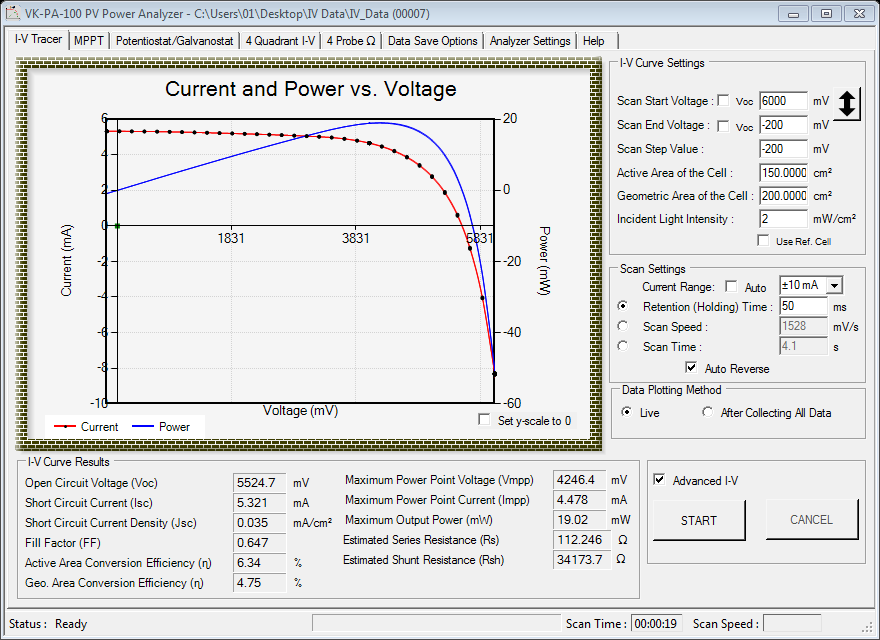
Screenshot of "Advanced I-V " tab of the control software
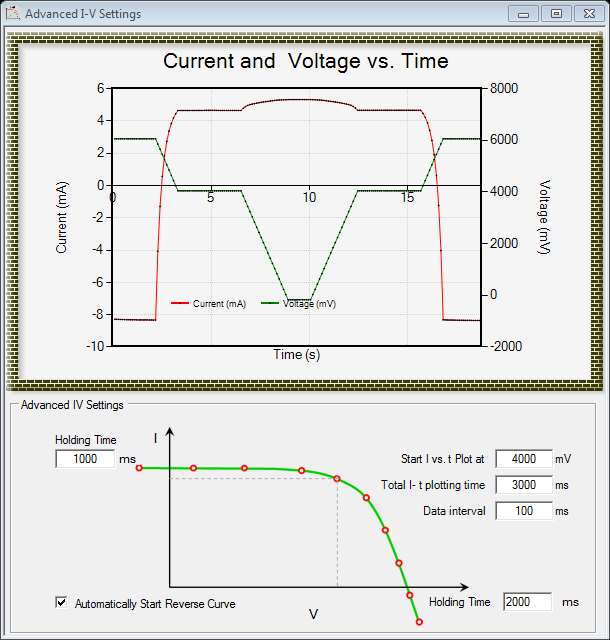
Screenshot of "Advanced I-V " tab of the control software
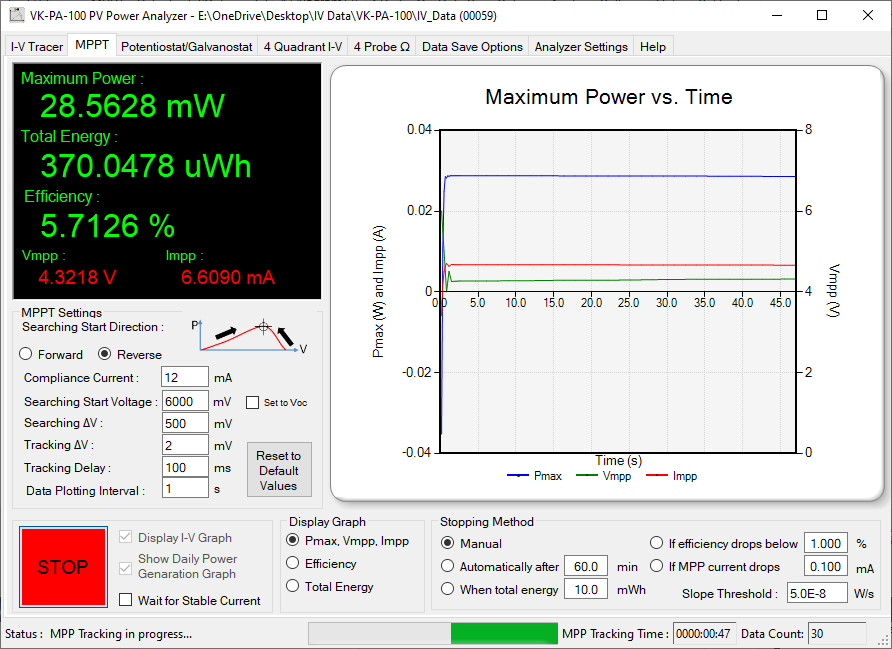
Screenshot of "MPPT" tab of the control software
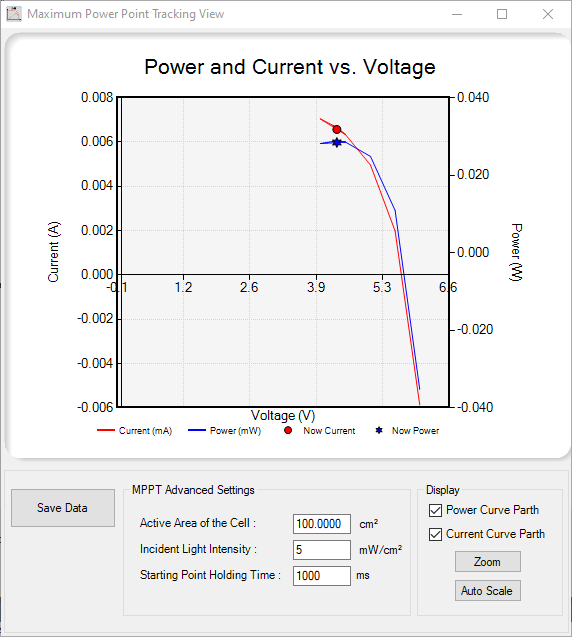
Screenshot of "MPPT" tab of the control software
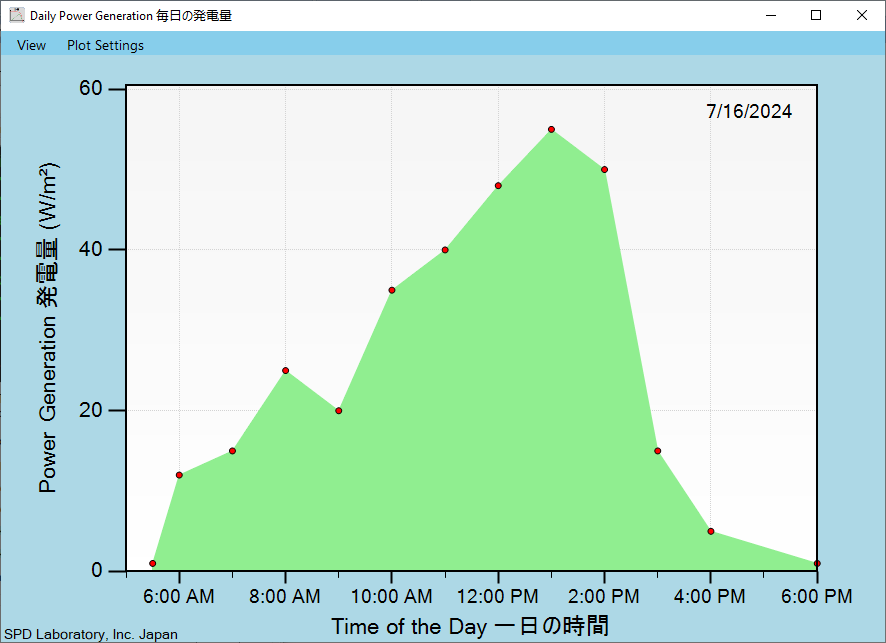
The MPPT function of the VK-PA-100 includes a special feature that displays the daily-power-generation plot in full-screen mode.
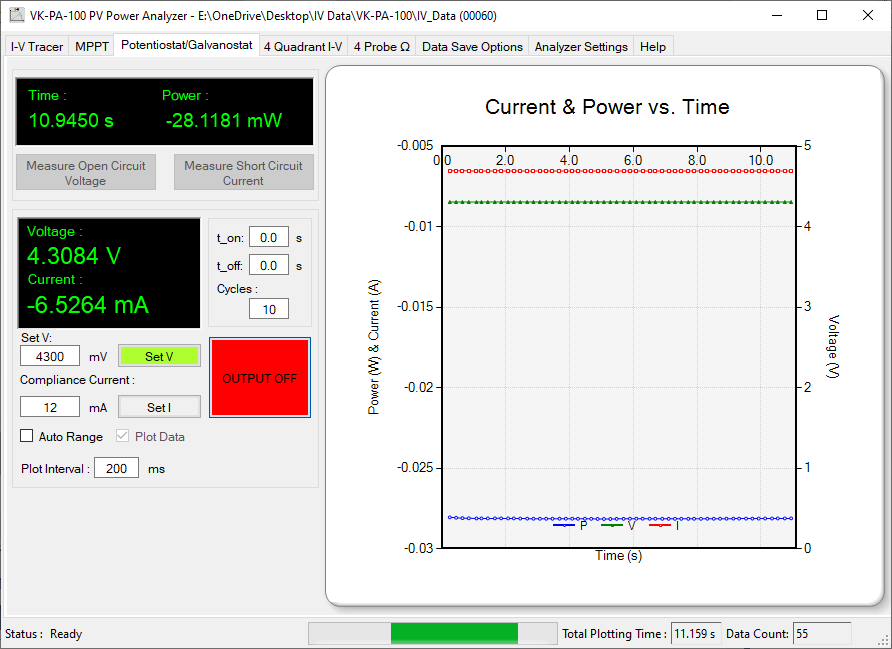
Screenshot of "Potentiostat Galvanostat" tab of the control software
Screenshot of "CV" tab of the control software
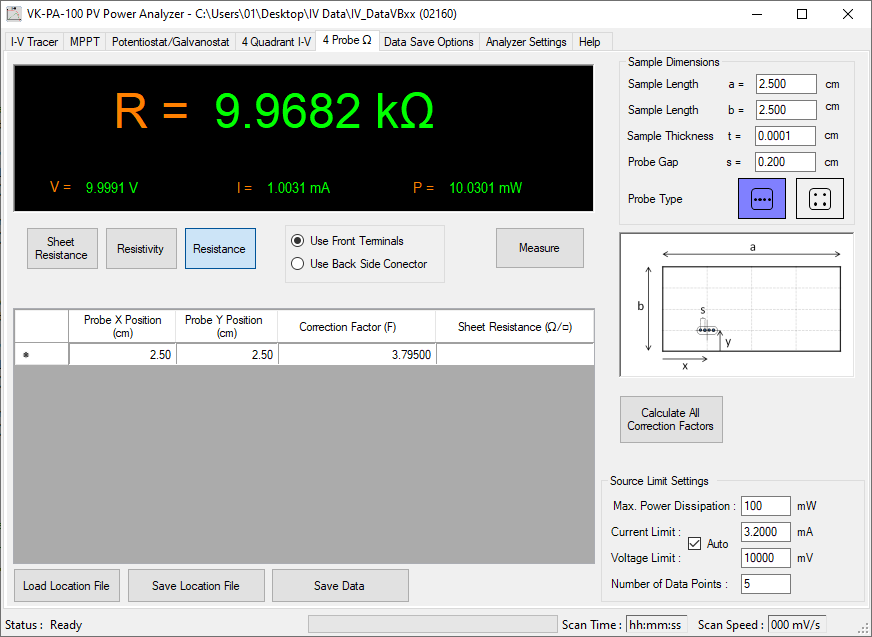
Screenshot of "4 Probe Ohm" tab of the control software
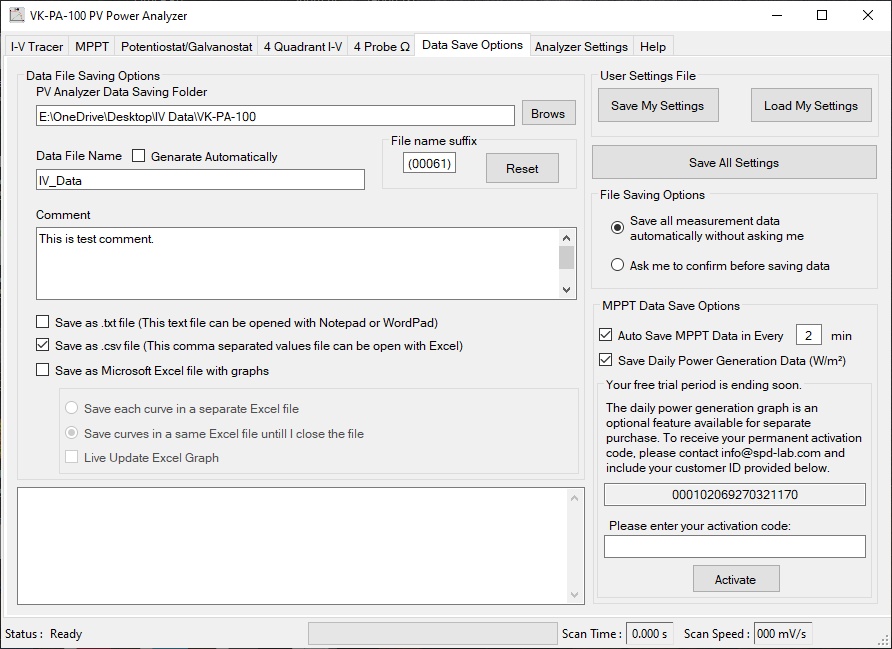
Screenshot of "Data Save Options" tab of the control software
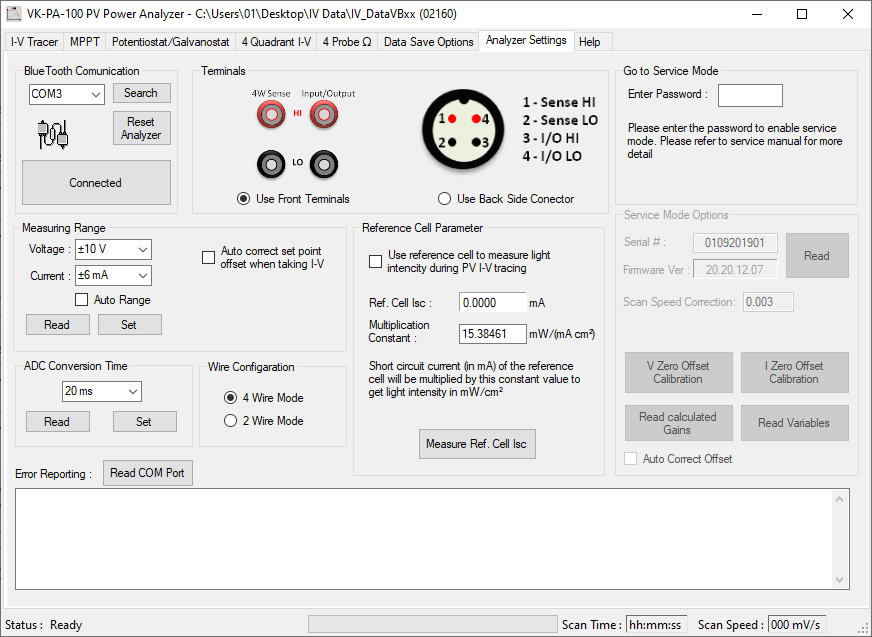
Screenshot of "Analyzer Settings " tab of the control software
|