For Pico Ampere Range I-V Tracing and
Pico Watt Range Maximum Power Point Tracking (MPPT)
Experimental results taken by Segawa laboratory, University of Tokyo
Click here to download pdf version of brochure
Findout the unique features of SPD Lab PV Power Analyzers
|
PV Power Analyzer VK-PA-Pico Specifications |
Measurement Range
|
Voltage: ±10 V
Current: Max. ±10 mA Min. 600 pA
|
| Current Measuring Ranges
|
±10 mA (resolution 300 nA)
±5 mA (resolution 160 nA)
±2.5 mA (resolution 80 nA)
±1.25 mA (resolution 40 nA)
±600 μA (resolution 20 nA)
±300 μA (resolution 10 nA)
±120 μA (resolution 4 nA)
±60 μA (resolution 2 nA)
±30 μA (resolution 1 nA)
±15 μA (resolution 500 pA)
±7 μA (resolution 250 pA)
±3.5 μA (resolution 100 pA)
±1.8 μA (resolution 60 pA)
±900 nA (resolution 30 pA)
±450 nA (resolution 15 pA)
±230 nA (resolution 7 pA)
±115 nA (resolution 4 pA)
±55 nA (resolution 2 pA)
±35 nA (resolution 1 pA)
±18 nA (resolution 0.6 pA)
±9 nA (resolution 0.3 pA)
±4 nA (resolution 0.1 pA)
±2 nA (resolution 70 fA)
±1 nA (resolution 35 fA)
±600 pA (resolution 17 fA)
|
| User Interface and data collecting |
Computer software is provided for control of all the functions and data logging. Measurement data can be saved as a text file and directly plotted on ®Microsoft Excel graph. (Windows based PC required) |
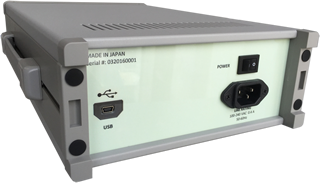
| Communication |
USB
|
| Power Requirement |
100 – 240 VAC (50-60 Hz) |
| Electrical standard |
  |
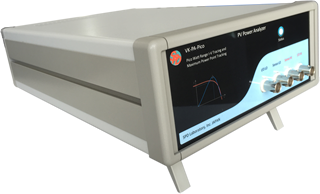
| Dimensions |
88 mm x 210 mm x 350 mm, 3.0 kg |
| Weight |
3.0 kg |
|
|
Main Functions |
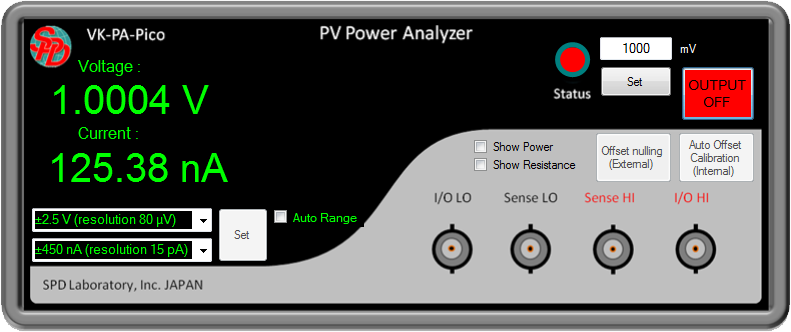
| Pico Ammeter |
|
In this mode, analyzer work as Ideal ammeter (voltage drop < 5 μV) to measure short circuit current of the cell. |
| Potentiostat |
|
In this mode, analyzer bias the cell to given constant voltage and measure current. Voltage, Current, Power or Resistance is displayed onscreen. It is also possible to plot those parameters against time.
|
| I-V Tracer |
|
In this mode, user can select START, END, STEP voltages and scan method (desired scan speed, scan time, or holding time). Analyzer plots current and power vs. voltage curves. Calculated results include Voc, Isc, Jsc, Pmax, Vmpp, I mpp, FF, Rs, RSH, ƞactiveA, and ƞgeoA . Advanced I-V option allows initial, middle, and end point holding times. I vs. t transient plot for all data points and/or under a selected fixed voltage. |
| Maximum Power Point Tracking (MPPT) |
| |
Analyzer acts like the best load for the cell to extract maximum power and keep tracking MPP continuously. Plots Pmax ,Vmpp , Impp and Efficiency vs. time curves and also display current/power vs. voltage plots. In addition user can directly measure the open circuit voltage, short circuit current and plot the current vs. time under a given fixed output voltage. |
| Four Quadrant I-V Analysis |
|
User selectable START, END, STEP voltages and SCAN SPEED (mV/s). Plot current vs. voltage curve for given number of voltage sweep cycles in potentiostat mode. Can be use in 3 electrodes liquid cell with reference electrode. |
|
VK-PA-Pico Software Downlaod
Version 6 (Bluetooth version 10V 10 mA)
VK-PA-Pico Software Version 6.1.1.1
Version 5 (USB version 10V 5mA)
VK-PA-Pico Software Version 5.2.3.5
VK-PA-Pico Software Version 5.1.1.1
Version 4
VK-PA-Pico Software Version 4.2.3.4
VK-PA-Pico Software Version 4.1.2.2
Click here to download
older versions |
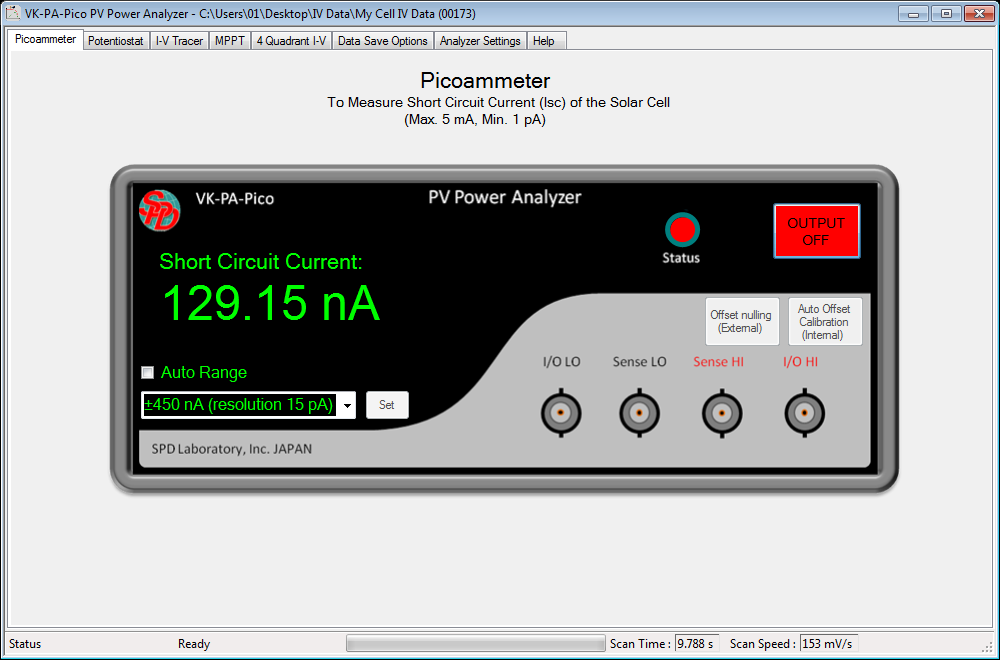
Screenshot of "Picoammeter" tab of the control software
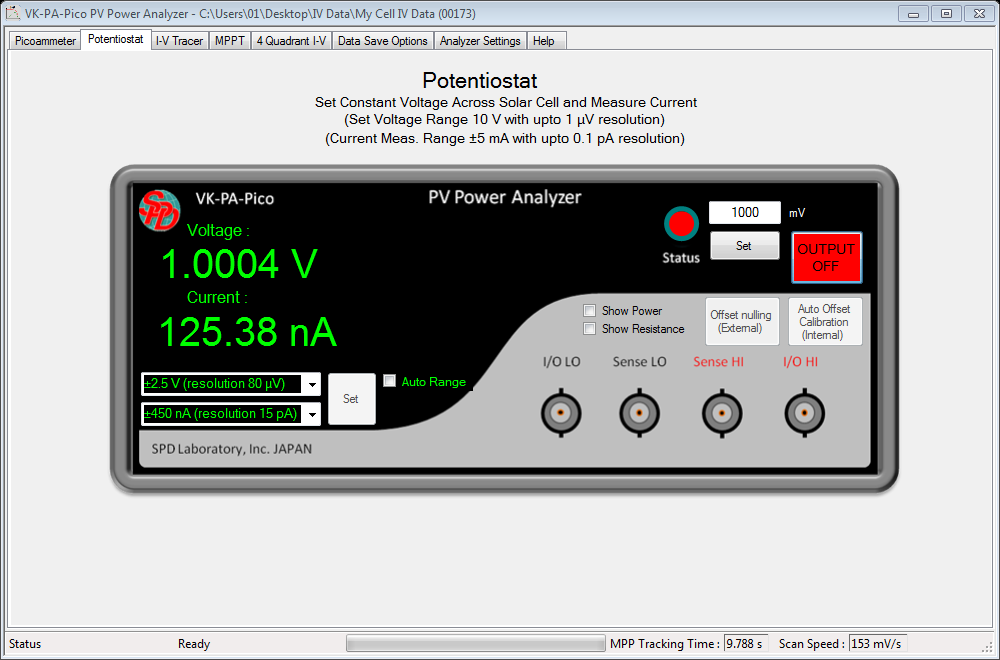
Screenshot of "Potentiostat" tab of the control software
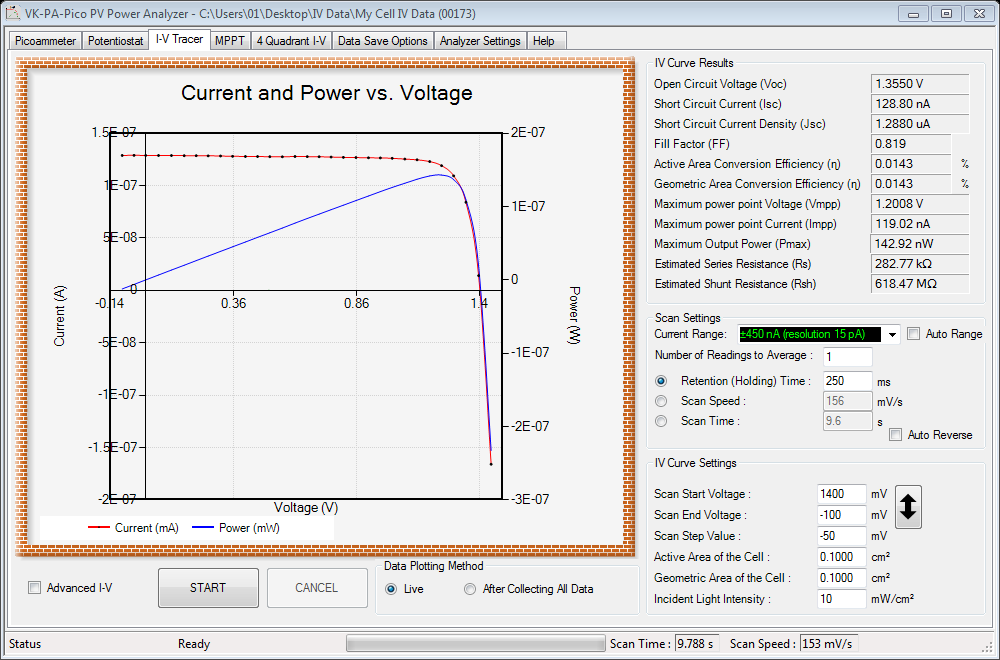
Screenshot of "I-V Tracer" tab of the control software
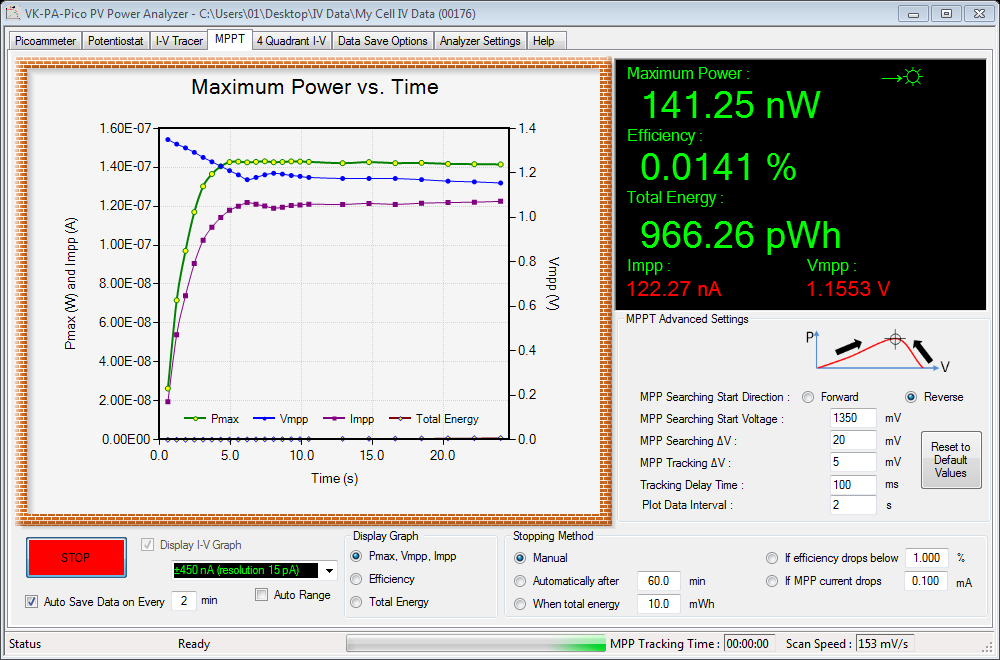
Screenshot of "MPPT" tab of the control software
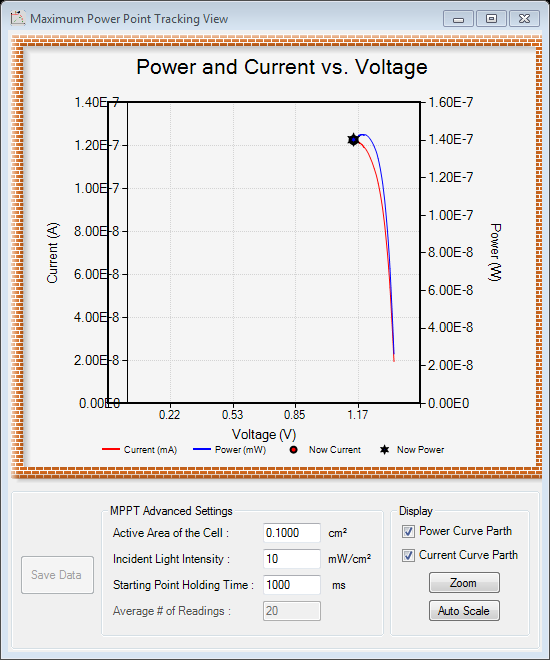
Screenshot of "MPPT" tab of the control software
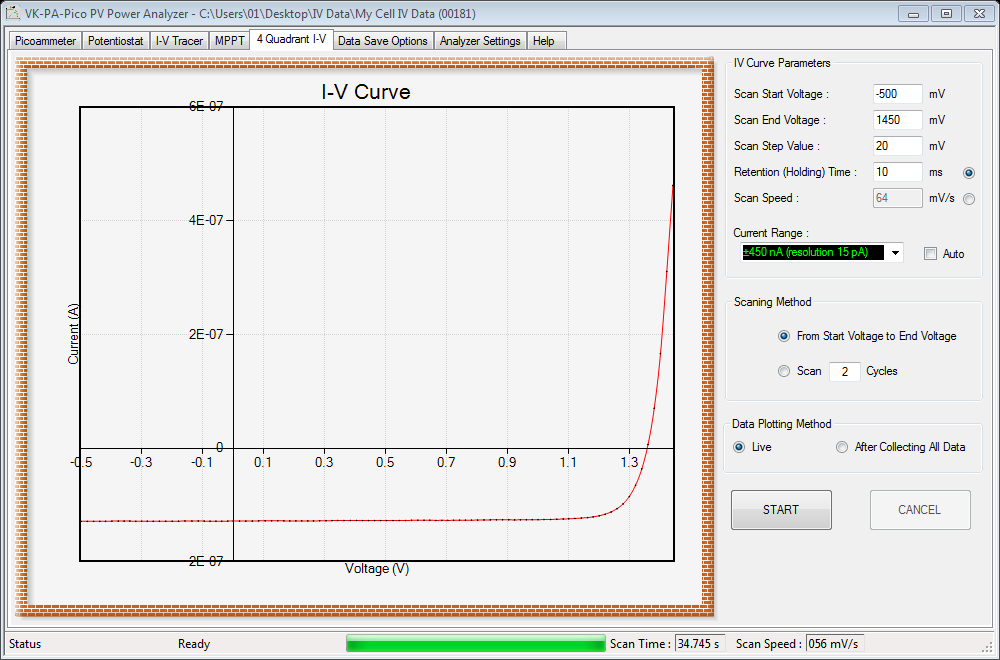
Screenshot of "4 Quadrant I-V" tab of the control software
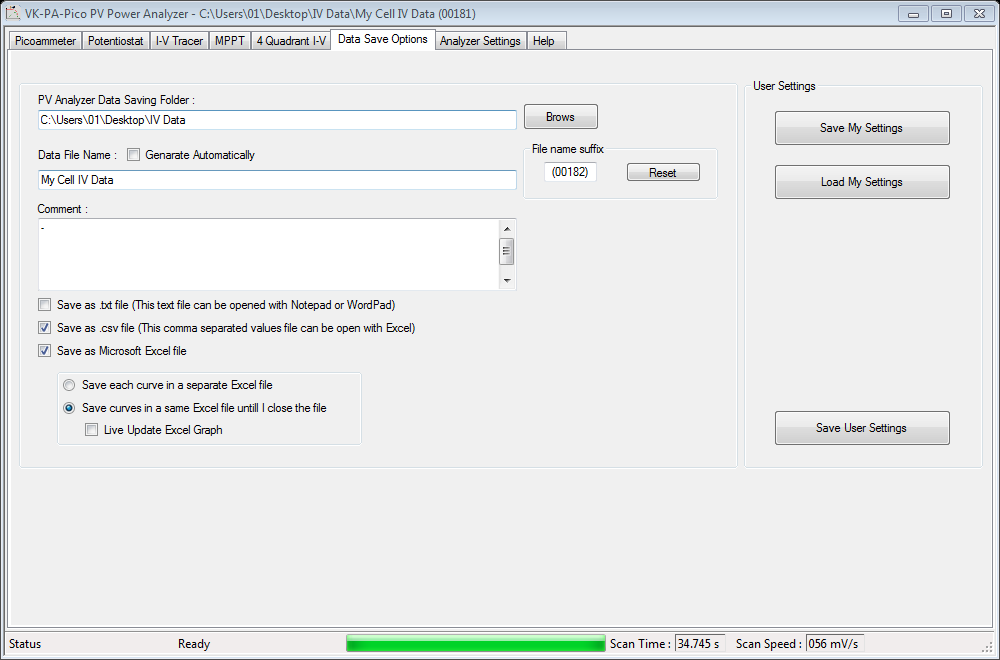
Screenshot of "Data Save Options" tab of the control software
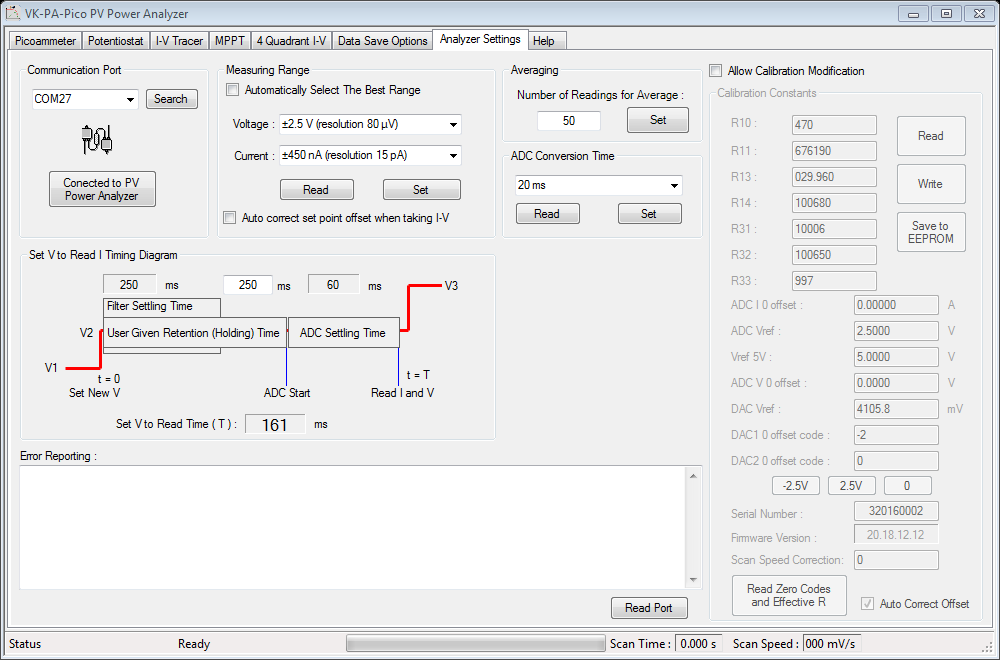
Screenshot of "Analyzer Settings " tab of the control software
|