Main Functions
-
Solar Cell I-V Curve Tracing
-
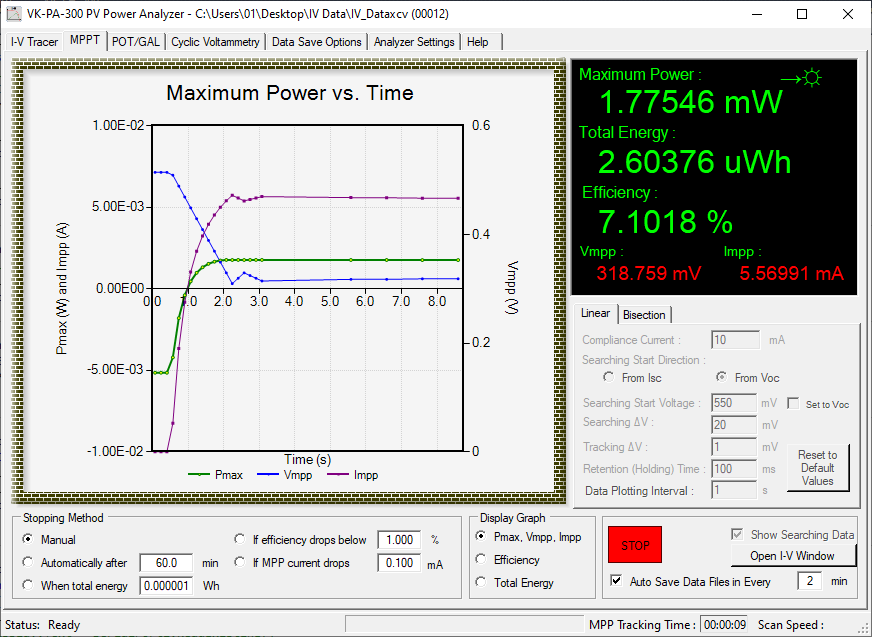
Maximum Power Point Tracking
-
Four Quadrant I-V Analysis
Experimental results taken by Segawa laboratory, University of Tokyo
Click here to download pdf version of brochure
Findout the unique features of SPD Lab PV Power Analyzers
|
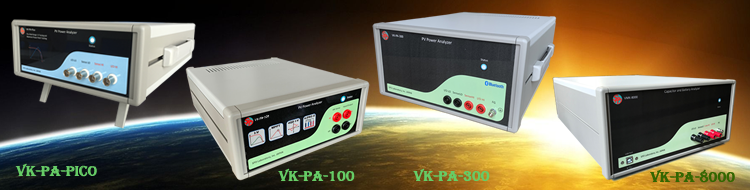
PV Power Analyzer VK-PA-300 Specifications |
Measurement Range
|
Voltage: ±12 V
Current: ±2A (±4 A Pulse)
with 5½-digits resolution |
Measuring Technique
|
Digital Source Meter |
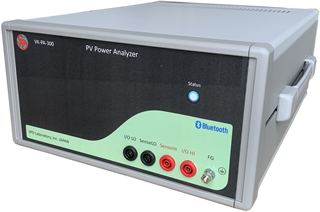
Inputs |
Front: 4 probes for PV devise
|
A/D Converters |
24 Bit (2 independent ADCs for V & I measurements)
|
User Interface and data collecting |
Computer software is provided for control of all the functions and data logging. Measurement data can be saved as a text file and directly plotted on ®Microsoft Excel graph. (Windows based PC required) |
Communication |
Bluetooth
|
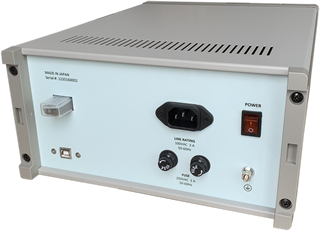
Power Requirement |
100 – 240 VAC (50-60 Hz) |
| Electrical standard |
  |
| Dimensions |
133 mm x 260 mm x 350 mm |
| Weight |
5 kg |
| |
|
Main Functions |
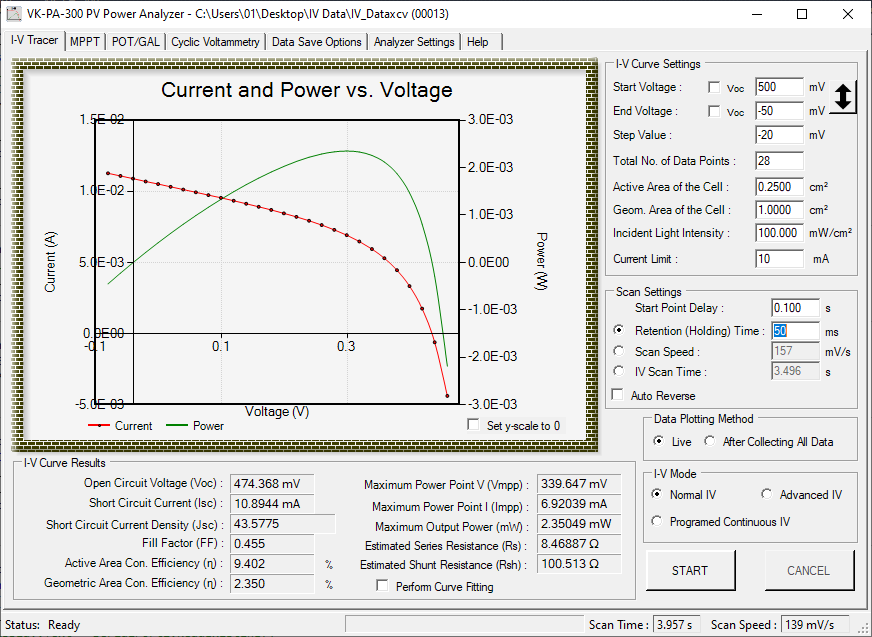
Solar Cell I-V curve Tracing |
 |
User selectable START, END and STEP voltages. Plots current and power vs. voltage curves. Calculated results include Voc, Isc, Jsc, Pmax, Vmpp, I mpp, FF, Rs, RSH, ƞactiveA, and ƞgeoA . User can set the desired scan speed, scan time, or holding time. Advanced I-V option allows initial, middle, and end point holding times. I vs. t transient plot for all data points and/or under a selected fixed voltage. |
Maximum Power Point Tracking (MPPT) |
 |
Analyzer acts like the best load for the cell to extract maximum power and keep tracking MPP continuously. Plots Pmax ,Vmpp , Impp and Efficiency vs. time curves and also display current/power vs. voltage plots. In addition user can directly measure the open circuit voltage, short circuit current and plot the current vs. time under a given fixed output voltage. |
cyclic voltammetry Analysis |
 |
User selectable START, END, STEP voltages and SCAN SPEED (mV/s). Plot current vs. voltage curve for given number of voltage sweep cycles in potentiostat mode. Can be use in 3 electrodes liquid cell with reference electrode. |
|